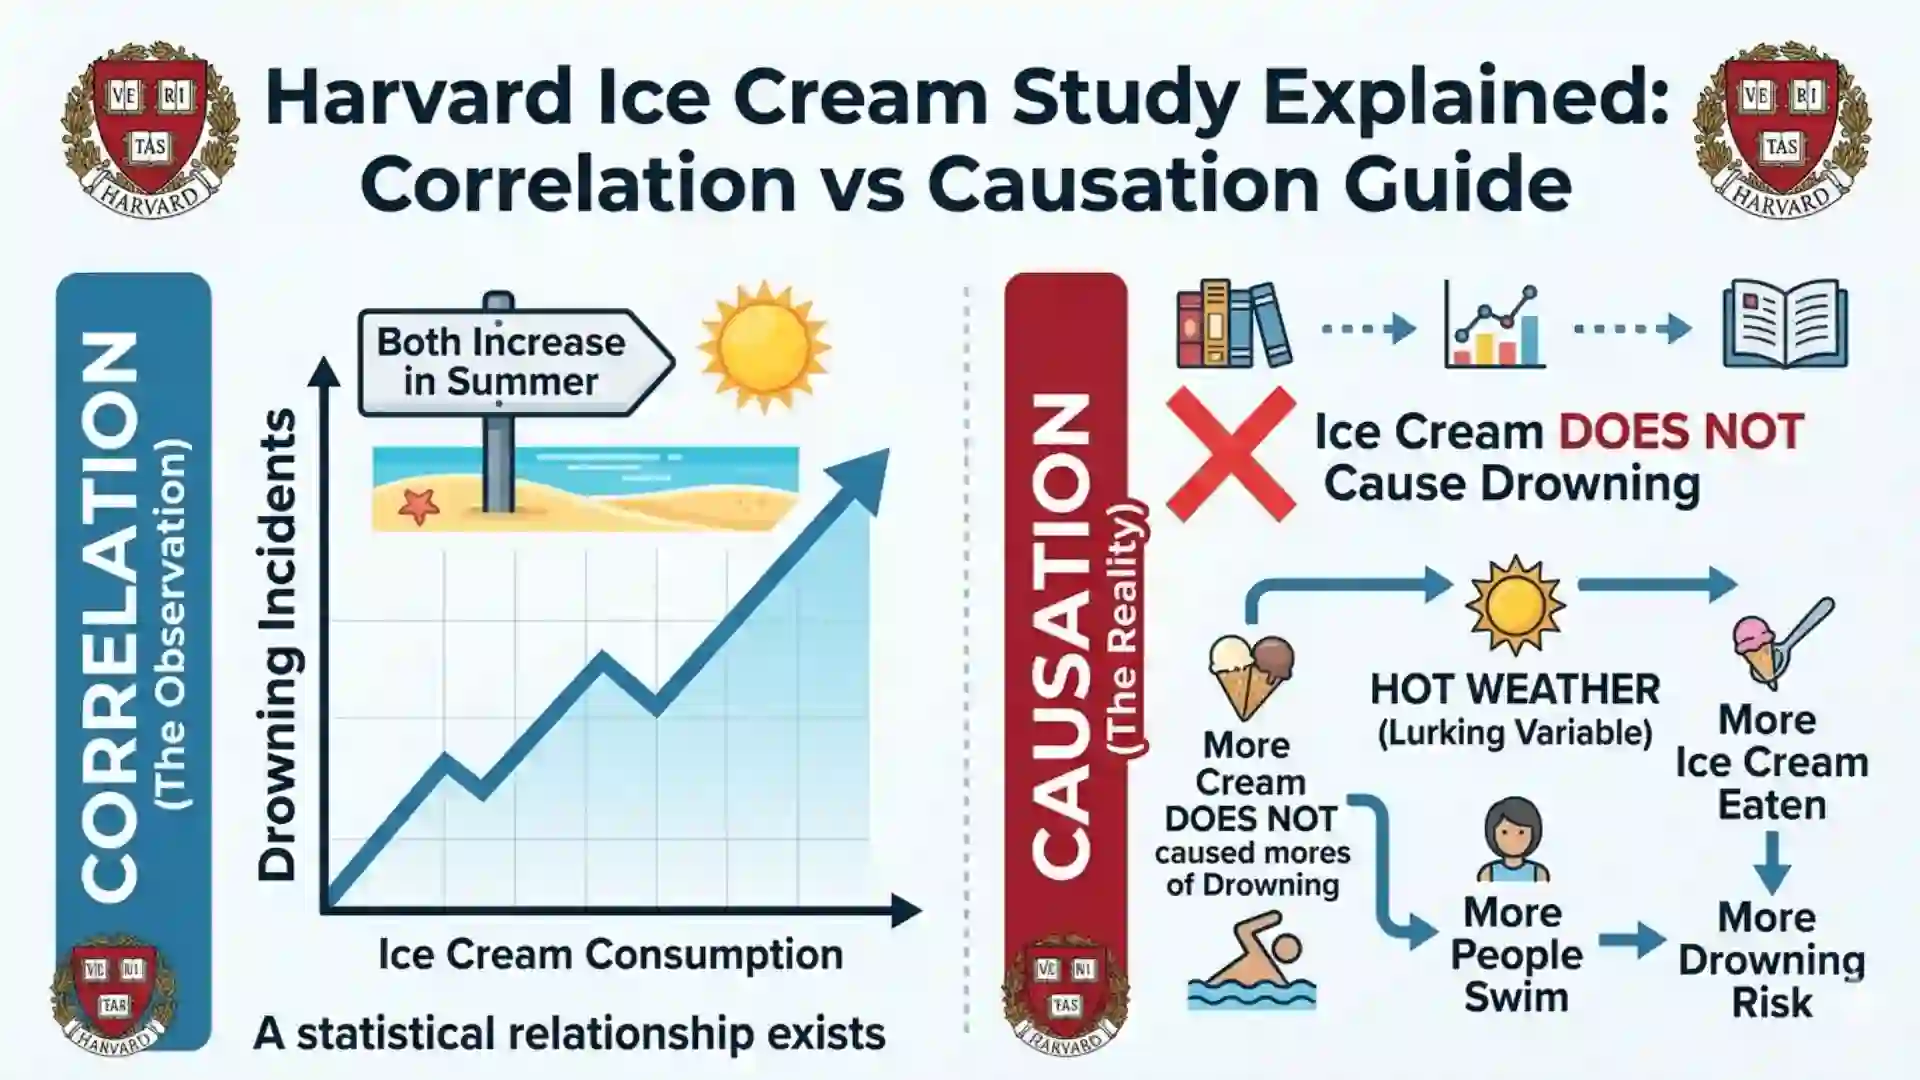
The so-called “Harvard Ice Cream Study” is one of the most widely discussed examples used in statistics, data analysis, and research methodology to explain the difference between correlation and causation. Although many people refer to it as a formal “Harvard study,” it is more accurately a teaching example frequently used in academic environments, including at institutions like Harvard University.
This article explores the concept behind the Harvard Ice Cream Study, its significance in data interpretation, real-world applications, and why understanding this example is crucial in today’s data-driven world.
What is the Harvard Ice Cream Study?
The Harvard Ice Cream Study refers to a classic statistical example:
- Ice cream sales increase during certain periods.
- At the same time, incidents such as drowning cases also increase.
- At first glance, it may appear that ice cream consumption causes drowning.
However, this is a misleading conclusion.
The real explanation lies in a third variable:
- Hot weather increases both ice cream consumption and swimming activity.
- More swimming leads to a higher risk of drowning.
Thus, ice cream sales and drowning are correlated, but one does not cause the other.
Important Information and Links
| Category | Details |
|---|---|
| Concept Name | Harvard Ice Cream Study (Correlation vs Causation Example) |
| Associated Institution | Harvard University |
| Field of Study | Statistics, Data Science, Research Methods |
| Key Concept | Correlation does not imply causation |
| Example Variables | Ice cream sales, drowning incidents, temperature |
| Real Cause | Hot weather (confounding variable) |
| Application Areas | Data analysis, business decisions, research |
| Official Harvard Website | https://www.harvard.edu/ |
Understanding Correlation vs Causation
What is Correlation?
Correlation means that two variables move together in some way. For example:
- When one variable increases, the other may also increase (positive correlation).
- When one decreases while the other increases (negative correlation).
In the ice cream example:
- Ice cream sales and drowning incidents both increase together.
What is Causation?
Causation means that one variable directly affects another.
For example:
- Smoking causes lung damage.
- Studying more often improves exam performance.
In the ice cream case:
- Ice cream does not cause drowning.
The Role of Confounding Variables
A confounding variable is a hidden factor that influences both variables being studied.
In this example:
- Temperature (hot weather) is the confounding variable.
How It Works:
| Variable | Effect |
|---|---|
| Hot Weather | Increases ice cream consumption |
| Hot Weather | Encourages swimming |
| Swimming | Raises drowning risk |
Thus, temperature is the real driver behind both trends.
Why This Example Became Popular
The ice cream example became famous because it is:
- Simple and easy to understand
- Relatable to everyday life
- Effective in teaching critical thinking
Professors and educators, including those at Harvard University, use similar examples to teach students how to interpret data responsibly.
Real-World Applications
1. Business and Marketing
Companies often analyze customer behavior using data.
Example:
- A business might see that higher advertising correlates with higher sales.
- But the real cause could be seasonal demand, not advertising.
2. Healthcare Research
Misinterpreting data can lead to serious consequences.
Example:
- A study might show that people who take a certain supplement are healthier.
- But the real reason could be that these people also follow healthy lifestyles.
3. Public Policy
Governments rely on data to make decisions.
Example:
- A rise in crime may correlate with increased mobile phone usage.
- But the real causes could be economic or social factors.
Common Mistakes in Data Interpretation
1. Assuming Direct Cause
People often jump to conclusions without analyzing deeper factors.
2. Ignoring Hidden Variables
Failure to identify confounding variables leads to incorrect conclusions.
3. Overgeneralization
Drawing broad conclusions from limited data.
4. Misleading Visualizations
Graphs and charts can exaggerate correlations.
Statistical Perspective
From a statistical point of view:
- Correlation is measured using coefficients (like Pearson correlation).
- Causation requires controlled experiments or deeper analysis.
Key Differences
| Aspect | Correlation | Causation |
|---|---|---|
| Definition | Relationship between variables | One variable affects another |
| Proof Required | Statistical association | Experimental or logical evidence |
| Risk | Misinterpretation | Stronger conclusion |
How to Identify True Causation
To determine causation, researchers use:
1. Controlled Experiments
- Randomized trials
- Control and test groups
2. Longitudinal Studies
- Observing changes over time
3. Statistical Controls
- Adjusting for confounding variables
4. Logical Reasoning
- Does the relationship make sense scientifically?
Modern Relevance in Data Science
In today’s world of big data and AI, the ice cream example is more relevant than ever.
Why It Matters:
- Businesses rely heavily on analytics
- AI models can detect patterns but not always causes
- Misinterpretation can lead to poor decisions
Even advanced systems must be carefully evaluated to avoid false conclusions.
Examples Similar to the Ice Cream Study
Example 1: Firefighters and Fire Damage
- More firefighters correlate with more damage.
- Reality: Larger fires require more firefighters.
Example 2: Shoe Size and Reading Ability
- Children with larger shoe sizes read better.
- Reality: Older children have both larger feet and better reading skills.
Example 3: Coffee Consumption and Productivity
- People who drink more coffee seem more productive.
- Reality: Busy professionals tend to drink more coffee.
Importance in Education
Educational institutions like Harvard University emphasize:
- Critical thinking
- Analytical reasoning
- Evidence-based conclusions
The ice cream example is often one of the first lessons students encounter in statistics courses.
Misuse in Media and Marketing
Many headlines and advertisements misuse correlation.
Examples:
- “Eating chocolate improves intelligence”
- “Watching TV causes laziness”
Such claims often lack proper causal evidence.
Advantages of Understanding This Concept
- Better decision-making
- Improved research accuracy
- Reduced misinformation
- Strong analytical skills
Limitations of the Ice Cream Example
While useful, the example is simplified.
Limitations:
- Real-world data is more complex
- Multiple confounding variables may exist
- Not all correlations are obvious
FAQ
Is the Harvard Ice Cream Study a real research paper?
No, it is primarily a teaching example rather than a formal published study.
What is the main lesson of the study?
The main lesson is that correlation does not imply causation.
What is a confounding variable?
A confounding variable is a third factor that influences both variables in a study.
Why is this example important?
It helps people avoid incorrect conclusions when analyzing data.
Can correlation ever imply causation?
Not by itself. Additional evidence and analysis are required.
Where is this concept used?
It is used in statistics, business, healthcare, research, and data science.
How can we avoid misinterpretation?
By identifying confounding variables, using proper research methods, and applying critical thinking.
Conclusion
The Harvard Ice Cream Study is a powerful and enduring example that highlights one of the most important principles in statistics: correlation does not imply causation. While the idea that ice cream consumption could cause drowning may seem absurd, it effectively demonstrates how easily data can be misinterpreted without proper analysis.
In a world increasingly driven by data, understanding this concept is essential. Whether you are a student, researcher, marketer, or policymaker, the ability to distinguish between correlation and causation can prevent costly mistakes and lead to better decision-making.
Institutions like Harvard University continue to emphasize this principle as a foundational element of education in statistics and data science. By applying this knowledge, individuals can become more informed, analytical, and responsible in interpreting the vast amounts of data available today.
For more information and academic resources, visit:
https://www.harvard.edu/